10x Debugging with Chrome DevTools MCP
A talk on letting a coding agent debug in a real browser. Chrome DevTools MCP connects agents such as Claude, Cursor or Copilot to a live Chrome, so they can record performance traces, read network requests and console errors, and check their own fixes.
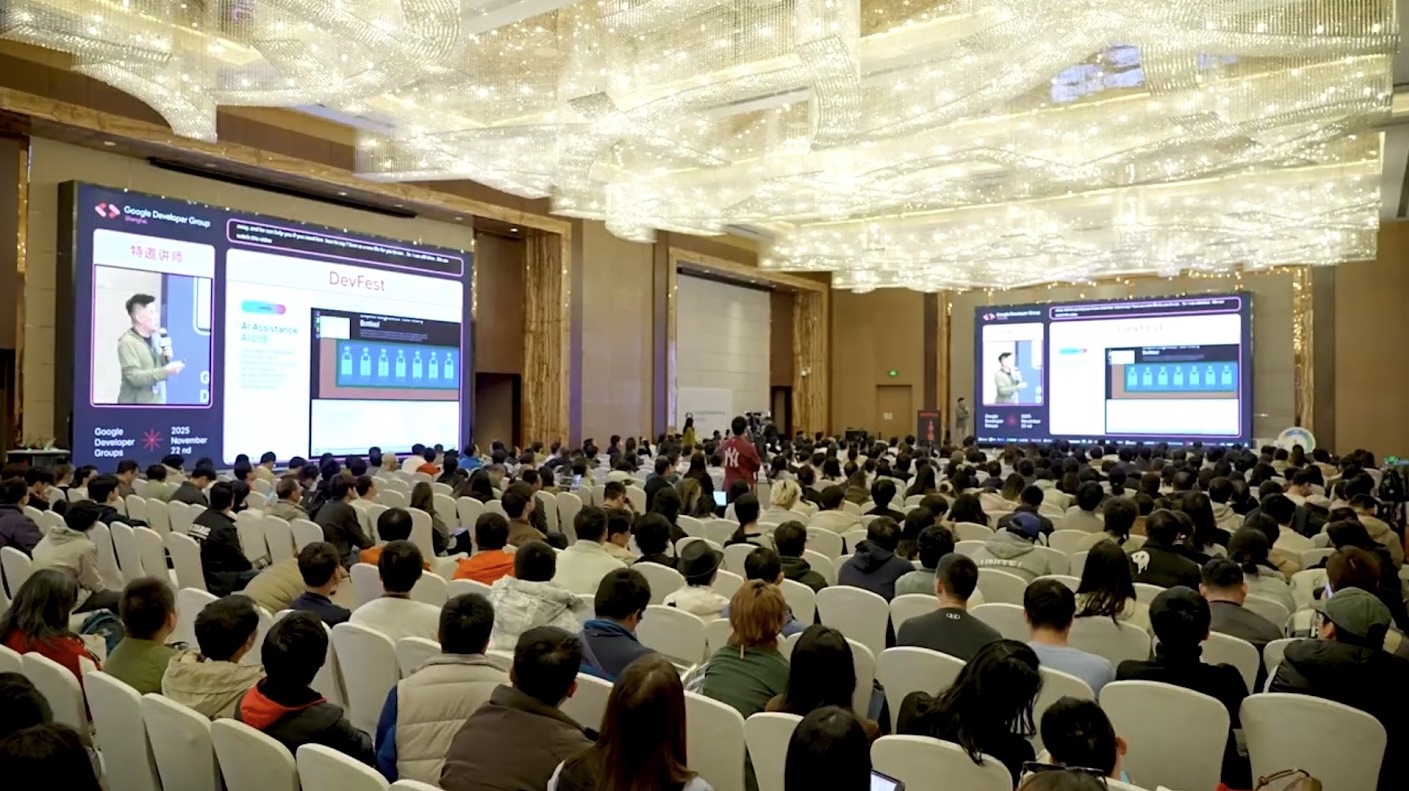
Roadshow schedule
| Date | City | Event |
|---|---|---|
| Shanghai | 2025 Google DevFest Shanghai |
DevTools and the gap with coding agents
Chrome DevTools does three jobs every front-end engineer relies on. It shows how a page performs, from Core Web Vitals to performance traces and memory. It lets you inspect and edit the resources a page loads: HTML, JavaScript, CSS, cookies, local storage and the console. And it records the network, with timing, headers, payloads and throttling to match real connections.
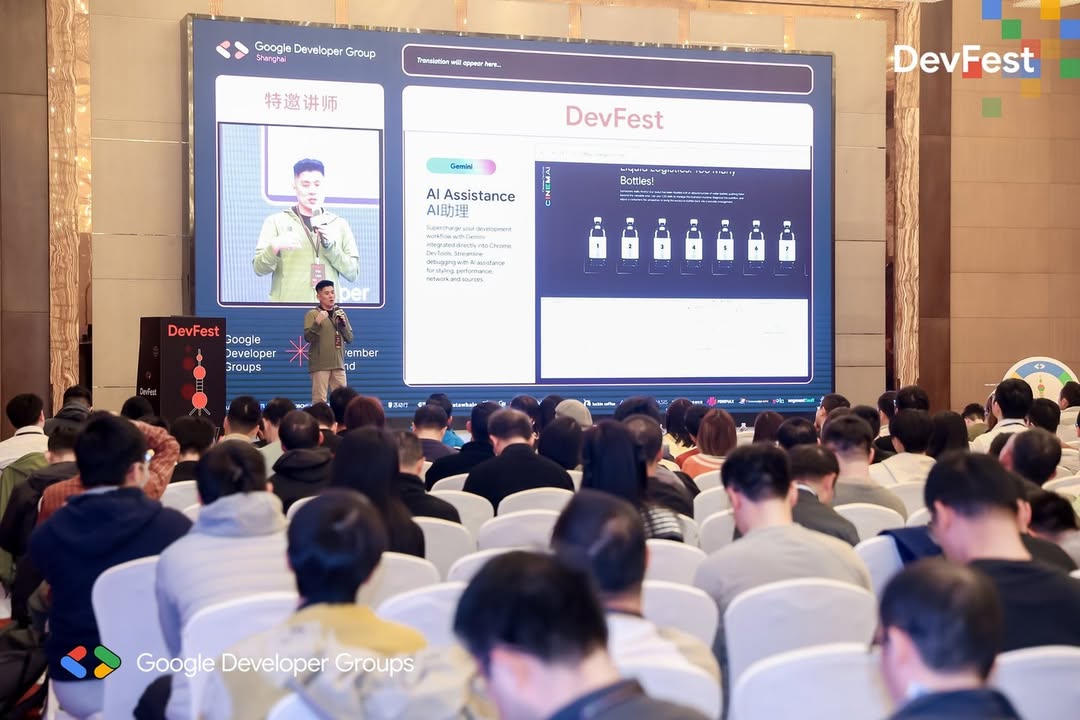
DevTools also has AI assistance powered by Gemini, which uses the page's context to help fix styling bugs, analyze network requests, understand source files and investigate performance. A coding agent in the editor sees none of this. It writes code without knowing whether the code works in the browser, so the developer tests by hand, switches between the editor and DevTools, and reports back what broke.
MCP
A language model has a knowledge cutoff and can only act through the tools it is given. For a while every vendor wired up tools its own way, so a tool built for one model did not work with another. MCP, the Model Context Protocol, is an open-source standard for connecting AI applications to external systems, introduced by Anthropic in 2024. A tool packaged as an MCP server works with any client that speaks the protocol.
Chrome DevTools MCP
Chrome DevTools MCP is the Chrome DevTools team's MCP server. It lets a coding agent such as Antigravity, Claude, Cursor or Copilot control and inspect a live Chrome browser. It records traces with DevTools to extract performance insights, reads network requests, screenshots and console messages with source-mapped stack traces, and drives the page with Puppeteer, waiting for each action to finish before the agent moves on. The agent can build a feature, open it in Chrome, see what went wrong and fix it without the developer relaying anything.
The default tools fall into six categories:
| Category | What the agent can do | Example tools |
|---|---|---|
| Input automation | Click, hover, type, fill whole forms, handle dialogs and upload files | click, fill_form, upload_file |
| Navigation automation | Open, switch and close pages, and wait for content to appear | navigate_page, new_page, wait_for |
| Emulation | Throttle network and CPU, set the viewport, geolocation or dark mode | emulate, resize_page |
| Performance | Record a trace and dig into insights such as Core Web Vitals | performance_start_trace, performance_analyze_insight |
| Network | List the page's requests and read any one in detail | list_network_requests, get_network_request |
| Debugging | Run scripts, read the console, take screenshots and accessibility-tree snapshots, run Lighthouse | evaluate_script, list_console_messages, take_snapshot |
As of September 2026 there are also memory tools for heap snapshots and tools for installing and reloading Chrome extensions, most of them behind flags.
Four demos
Each demo is a single prompt to a coding agent with Chrome DevTools MCP connected.

Performance insights
Assess the website performance for www.blockonomics.co
The agent opens the site in Chrome, records a performance trace, reads the insights DevTools extracts from it and reports what slows the page down.
Debugging a hover menu for accessibility
Please assess the flyout navigation on chrome.dev/devtools-times in terms of accessibility. Hover on any of the items to reveal the flyout
The agent hovers to open the menu, takes an accessibility-tree snapshot of what appears and reviews it, which is hard to do from source code because the flyout exists only after the hover.
A broken form, fixed and verified
@index.html my form is unable to submit. It's served at http://localhost:8001. Please use DevTools to test and confirm the issue, provide a fix, and validate it's working
The agent reproduces the failure in the browser, reads the console and network activity to find the cause, edits the file, reloads and submits the form again to confirm the fix.
Browser automation
Go to duckduckgo.com and input "DevFest Shanghai 2025" in search input, and proceed with search, then wait for the result to provide a list of top 10 results with only title, description and link
The same tools that debug a page can operate one: the agent types the query, submits it, waits for the results to load and returns them as a list.
Getting started
Chrome DevTools MCP works with any MCP client. It needs a current Node.js LTS release, npm and a current stable Chrome. Most clients take the same configuration:
{
  "mcpServers": {
    "chrome-devtools": {
      "command": "npx",
      "args": ["-y", "chrome-devtools-mcp@latest"]
    }
  }
}
The server exposes everything in its browser to the agent, which can inspect, debug and modify any data there. Keep personal and sensitive information out of that browser session.
- chrome-devtools-mcp on GitHub: features, configuration, requirements and the data disclaimer, with the tool reference.
- What is the Model Context Protocol?, modelcontextprotocol.io.
- AI assistance, Chrome DevTools documentation.